NOAA Chart Offsets - Has this happened to you?
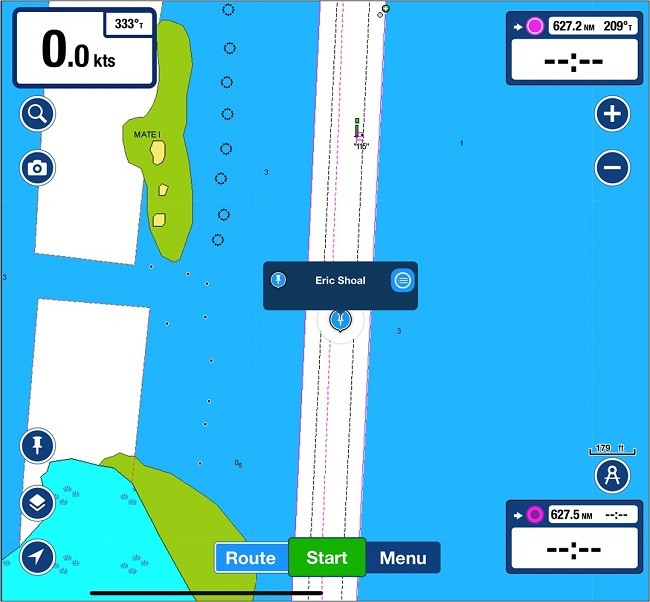
Have you ever been in the middle of a channel and found yourself aground? That happened on 11/23/2022 to Eric headed south on the ICW just north of Coinjock, North Carolina. Here's what he saw on his chartplotter running Navionics' "Nautical Chart" option:
Eric reasonably thought a new shoal had suddenly appeared as his boat came to a halt. How can this be? He's directly centered in the channel! It's a well-traveled route with dozens of boats passing through the area daily who did not report a shoal.
Puzzled, Eric dutifully reported the new shoal to the ICW Cruising Guide site (17,800 members) so others could avoid the danger. He helpfully provided the latitude and longitude of his grounding which is shown in Fig 1.
I saw his posting and formed the waypoint "Eric Shoal" shown in Fig 1. Let's see where that waypoint is displayed in Aqua Map with the USACE survey overlay.
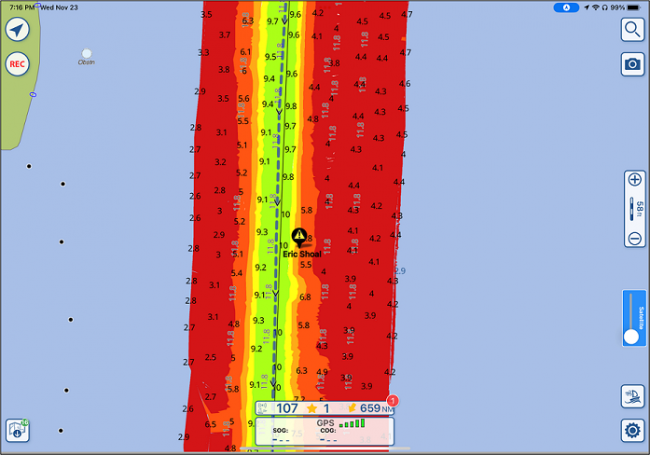
"Eric Shoal" is now shown on the edge of the channel and into the shallows. Why do the two charts show the grounding to be in different locations? The Navionics chart is derived from the base NOAA chart but the Aqua Map USACE survey is referenced to lat/long based on GPS, the WGS Datum.
Some older NOAA charts are referenced to lat/long too but from pre-GPS techniques such as visual sightings, shore features, etc.
There can be differences in location as you see in this example. Specifically, each depth reading in a USACE survey is tied to a GPS location, there will not be an offset since GPS positioning was used in the survey, the same GPS location data used by the navigation program or app to plot your location.
Navionics SonarChart also uses GPS positioning for plotting depth contours. Let's take a look at the same "Eric Shoal" on SonarChart.
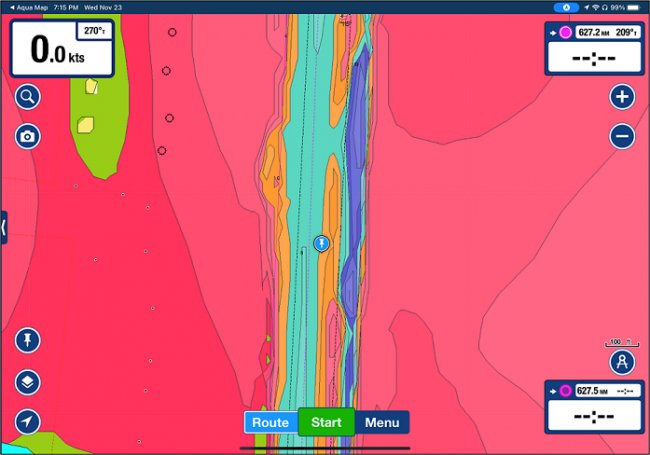
Navionics SonarChart also shows "Eric Shoal" on the side of the channel towards a shoal. Like USACE surveys, the depth contours in SonarChart are tied to GPS lat/long coordinates, there is no offset. Aqua Map can display the base NOAA chart without the USACE survey overlay, let's take a look.
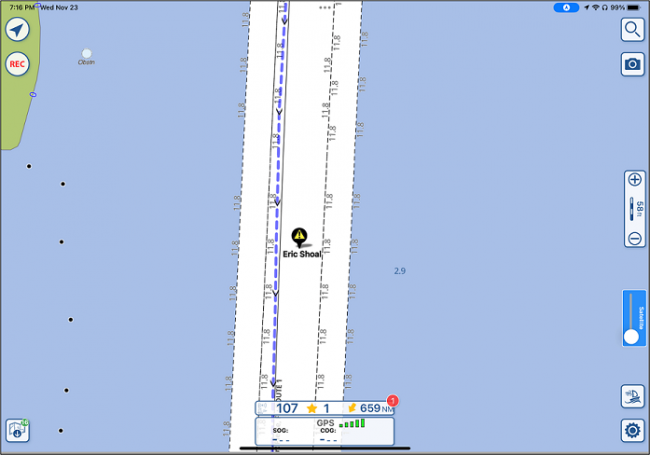
You can see that the "Eric Shoal" is shown neatly centered in the NOAA chart channel. No wonder Eric was surprised when he came to a sudden stop. The blue dotted line is the Bob423 track for the area that is centered in the real channel per the USACE surveys. You can see that it's located to the west of "Eric Shoal" and is not centered in the NOAA chart channel.
What's the takeaway here? When traveling the ICW, one should always use Aqua Map with the USACE survey overlays that are referenced to the same GPS datum used by your navigation devices. With that setup, there will be no offset.
Additional aids are the four Bob423 tracks that follow the deepest water on the ICW from Norfolk, Virginia to Ft Lauderdale, Florida. It's the blue dotted line shown in Fig 4. They are available for free downloading at: https://bobicw.blogspot.com
As a backup, use Navionics SonarChart when a USACE survey is not available. SonarChart is also referenced to the same GPS datum as the GPS on your boat. NOAA is improving its charts all the time and, in most places, uses the same datum as your GPS receiver but not everywhere. After all, who wants the "learning experience" of a grounding?